Understanding demographic pay gaps

If you’re reading this blog, you may already be working on a strategy for identifying and eliminating your pay gaps, or you may also just be testing the waters. In this three-part blog series, we talk about what demographic pay gaps are and how to calculate them in a way that will help you find and address pay inequity within your organization.
The first part of the series served as an introduction to two major ways to calculate your pay gaps, using the average and median. We also dipped our toes into regression analysis (which we’ll explore in greater detail in part 3). In this blog, we look at the nature of pay gaps to help you understand exactly what it is you’re trying to fix and where it came from. We’ll touch on different types of demographic pay gaps and some of their major causes.
Pay gaps 101: A quick refresher
You may have seen the statistic that on average, the gender pay gap is about 20% in the United States (i.e., women make, broadly speaking, 80 cents on the U.S. dollar relative to men).
That number refers to the unadjusted pay gap, which measures the average difference in pay between men and women. The adjusted pay gap, on the other hand, measures the difference in pay between women and men after accounting for valid factors that determine pay, such as job role, education, and experience. As Figure 1 illustrates, pay gaps are not solely based on gender: pay gaps may be correlated to many (at times, intersecting) demographic factors, including race, age, nationality, and even ability. In this article, we’ll emphasize gender and race.
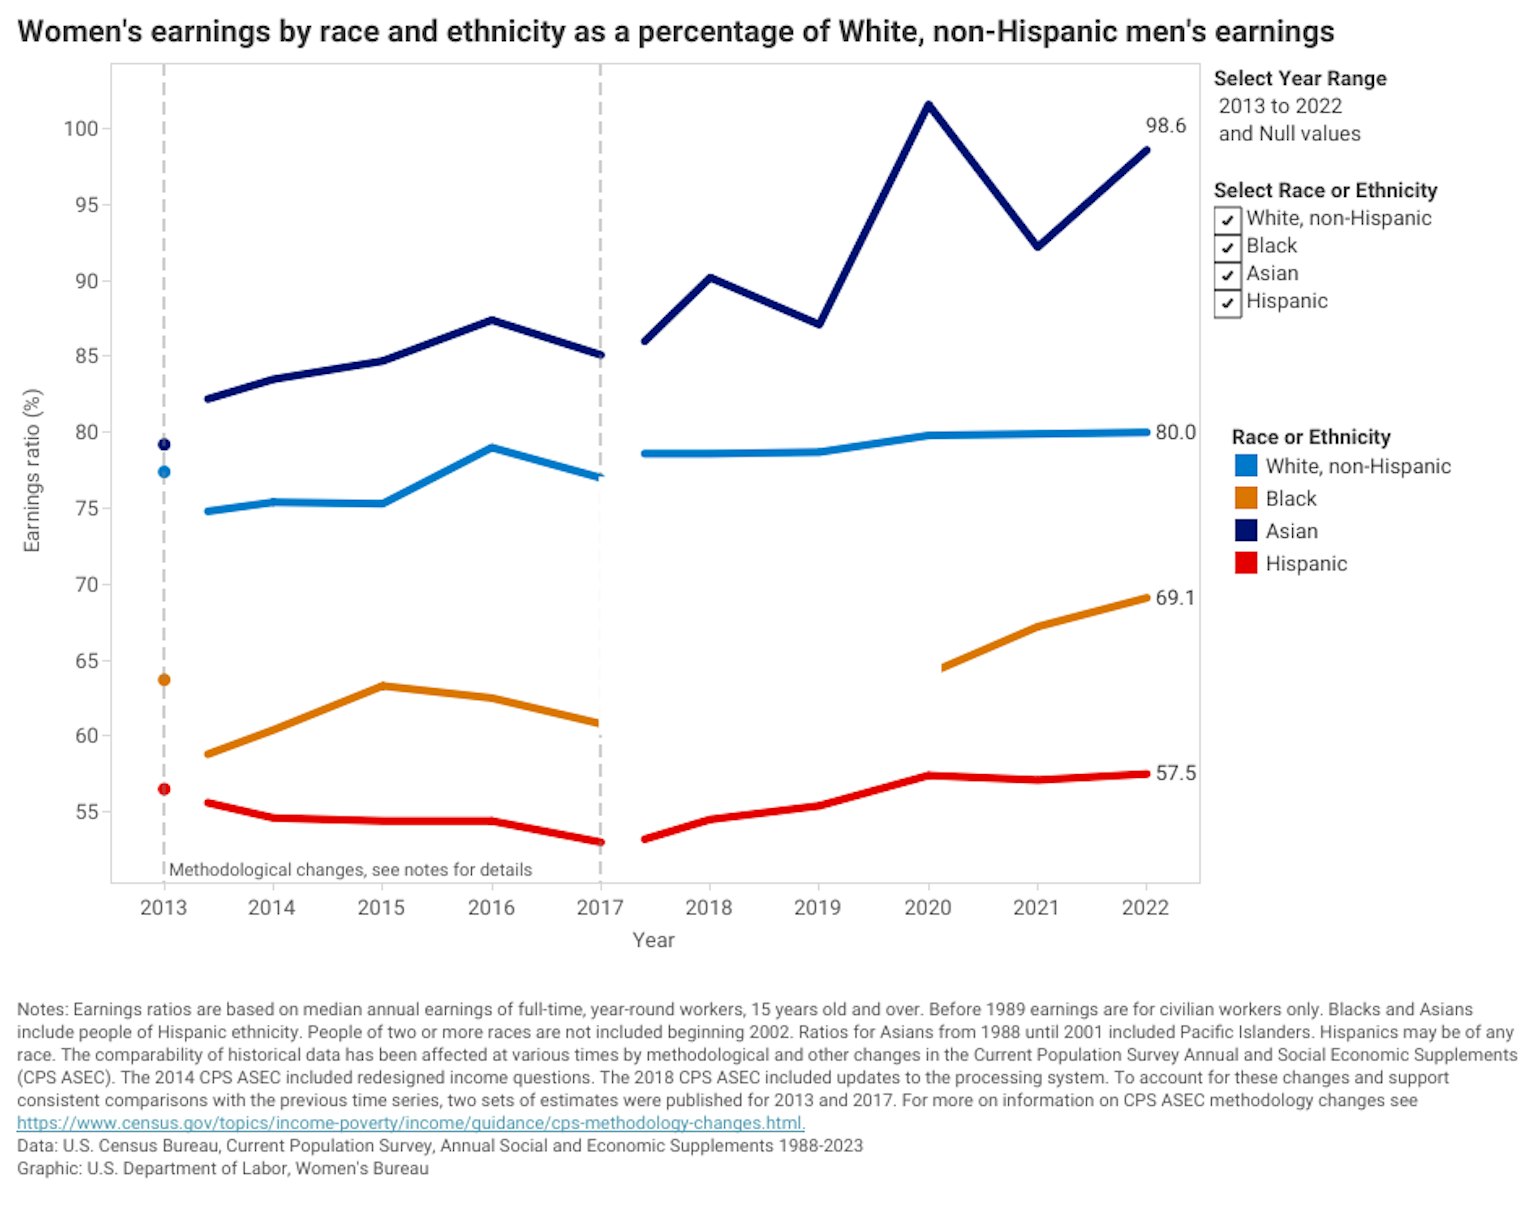
Figure 1. Models the absolute/unadjusted pay gap from 2013-2022, illustrating the difference in median annual earnings among Black, Asian, Hispanic, and White non-Hispanic women in the United States relative to White non-Hispanic men. Source: U.S. Census Bureau/U.S. Department of Labor.
Pay equity is a complex issue with far-reaching consequences. To review the fundamentals (in 15 minutes or less), read our Pay Equity Ultimate Guide.
What causes the pay gap?
We often frame the pay gap in terms of the difference between individuals’ earnings. For instance, let’s say that Fred and Wilma work for the same company, but Fred makes $60,000 per year and Wilma makes $40,000 per year. There is a pay disparity of $20,000 between the individual earnings of Fred and Wilma. If Fred and Wilma both have five years of experience and each supervise three employees, the lack of pay parity between them is probably not justified or equitable (whereas, if Wilma had two years of experience and hasn’t supervised employees, the pay difference may be sound). In this instance, the decisions that resulted in this pay difference may have been driven by unconscious bias. But individual earnings are not the sum total of pay inequity.
In this coffee talk episode, Margrét and Henrike discuss big questions like "Where does the equal pay gap come from?", and "Are there any patterns?". They also give helpful advice for companies on their pay equity journeys.
There are deeply rooted factors at play that perpetuate pay gaps among demographic groups that feed and are fed by unconscious bias. We’ll look at two major causes of pay gaps below.
Labor market disadvantages
At the global, national, and cultural levels, demographic pay gaps originate when minority groups are at a labor market disadvantage. This means that the jobs that are available and accessible to them are generally lower paying than the jobs available and accessible to the majority population.
The causes of labor market disadvantages are complex. Socioeconomic factors may mean higher barriers to entry for members of some groups. For instance, a child of immigrants who wants to get an advanced degree may have less family financial support than their native-born peers. Or women may find themselves working in the unpaid care economy for a number of years, so when they later need or want to work outside the home, their lack of formal labor market participation puts them at a disadvantage compared to male peers. Or within a given society, certain jobs are non-normative for certain groups of people—for instance, in most places, few women become truck drivers or coal miners and few men become preschool teachers. This narrows people’s options and makes workplace participation more difficult.
Labor market disadvantages often have deep historic roots in systems of inequality, oppression, and labor exploitation.
So the causes are complex, but some main driving factors include:
Lack of generational wealth.
Some minority demographic groups have been historically and systematically denied fair pay or other means of accumulating wealth, like home ownership. 68% of Black Americans surveyed by the Pew Research Center say they do not currently have enough wealth to live the type of life they want: This means they may not be able to provide their families with the same financial support as their majority group peers. For the younger generation, as a result, post-secondary education may be harder to come by and their career choices are under more pressure. So they may be more likely to end up taking jobs that offer less in terms of pay, benefits, and opportunity for advancement.
Occupational stereotyping.
Certain jobs can become associated with certain groups of people. If those people tend to be minority groups, then those jobs can become undervalued quickly. For example, in the U.S., a lot of childcare workers and teachers are women and a lot of farm workers are immigrants, and these demanding jobs typically do not pay well.
Under-representation in leadership.
Lower rates of hiring and promotion mean that there are relatively few people of minority demographic groups in the highest-paid positions. It’s estimated that, among countries surveyed by the International Labor Organization, only 1 in 4 C-level leaders is a woman, and only 1 in 20 is a woman of color. This lack of representation at the highest levels brings down the average pay for the under-represented group.
Time out of the workforce and working hours.
Members of some demographic groups are more likely to be caretakers to family members. Women may be the ones primarily responsible for childcare, so they may struggle to meet a job’s stated schedule—or they may not be able to put in the extra hours that are an implicit job requirement. If they’ve taken maternity leave, employers might also consider them to have less job tenure and experience. People with disabilities who have had to step away from work to address health needs can also run into this barrier.
Workplace disadvantages
In addition to the labor market disadvantage caused by some or all of the factors above, members of minority groups might also face a workplace disadvantage. This is basically the same thing as the labor market disadvantage, but at the organizational level. Since we’re all immersed in the culture that surrounds us like fish in water, decision-makers may inadvertently absorb the workplace culture’s biased attitudes towards certain groups of people. Even the most well-intentioned leaders can have unconscious bias. Our workplaces can become mirrors of social inequalities and, in so doing, perpetuate them.
It’s worth noting that workplace disadvantages and demographic pay gaps aren’t evenly distributed throughout an organization. Some locations, departments, or job roles may be more or less diverse or may have bigger or smaller pay gaps than others. If you’re looking for more information on the origins and causes of the gender pay gap, you might find this Coffee Talk helpful.
Other variables that can drive the pay gap (and their intersection)
It’s important not to lose sight of the variability of pay gaps. They can be based on many other individual or intersectional demographic factors, too. Those often include:
- An employee’s country of origin: i.e., sometimes immigrants are paid less than native-born workers.
- Location: companies with multiple far-flung offices may pay differently based on location, and these differences may or may not be fair based on cost of living.
- Gender identity and sexual identity: i.e., on average in the U.S., LGBTQ+ workers make only 90 cents for every dollar non-LGBTQ+ workers make.
Importantly, pay gaps can be intersectional, meaning they negatively affect employees in two or more minority demographics. So, in terms of the unadjusted pay gap, even though women in the U.S. make around 80% of what men make, that number drops to 67.5% for Hispanic/Latino women based on median annual earnings, according to the U.S. Department of Labor. There’s a lack of definitive data about the intersectional and LGBTQ+ pay gap, but, by some estimates, this figure hovers around 10%, and deepens for transgender women and gender nonconforming individuals—making this an important avenue for attention.
Demographic pay gaps in the real world
There are far too many real-life examples of demographic pay gaps. We find one example of an unadjusted gender pay gap in Japan. As of 2021, the nation measured its gender pay gap at 22.05%; one major reason for the divide is that management positions are overwhelmingly male-dominated. (Advancing to a management role in Japan requires putting in long overtime hours that may preclude caregivers).
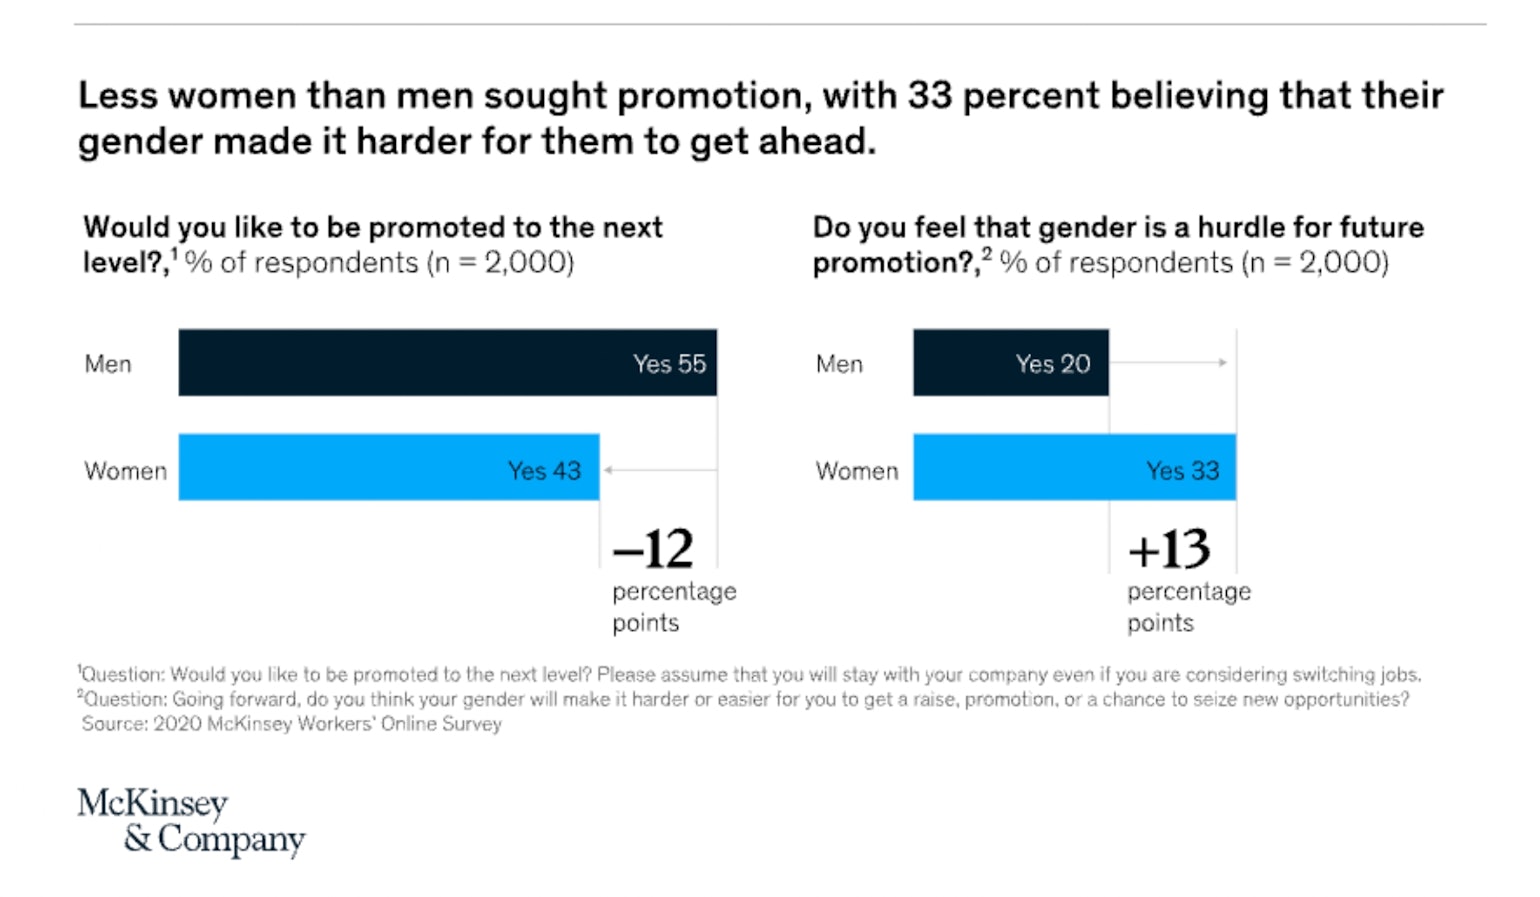
Figure 2. 33% of women workers in Japan believe their gender made it harder for them to seek promotion. Source: McKinsey & Company.
Another well-known example of an unadjusted racial pay gap comes from the U.S., where there is a strong relationship between race and the wage gap. Even after slavery was abolished, racist laws and discriminatory practices have put generations of Black Americans at a serious labor market disadvantage in many sectors. According to the Pew Research Center, occupations where Black workers in the U.S. make up 25% or more of the workforce tend to have lower barriers to entry, such as postal work, nursing, or public transportation (a labor market disadvantage). These individuals face steep challenges in entering into STEM fields.
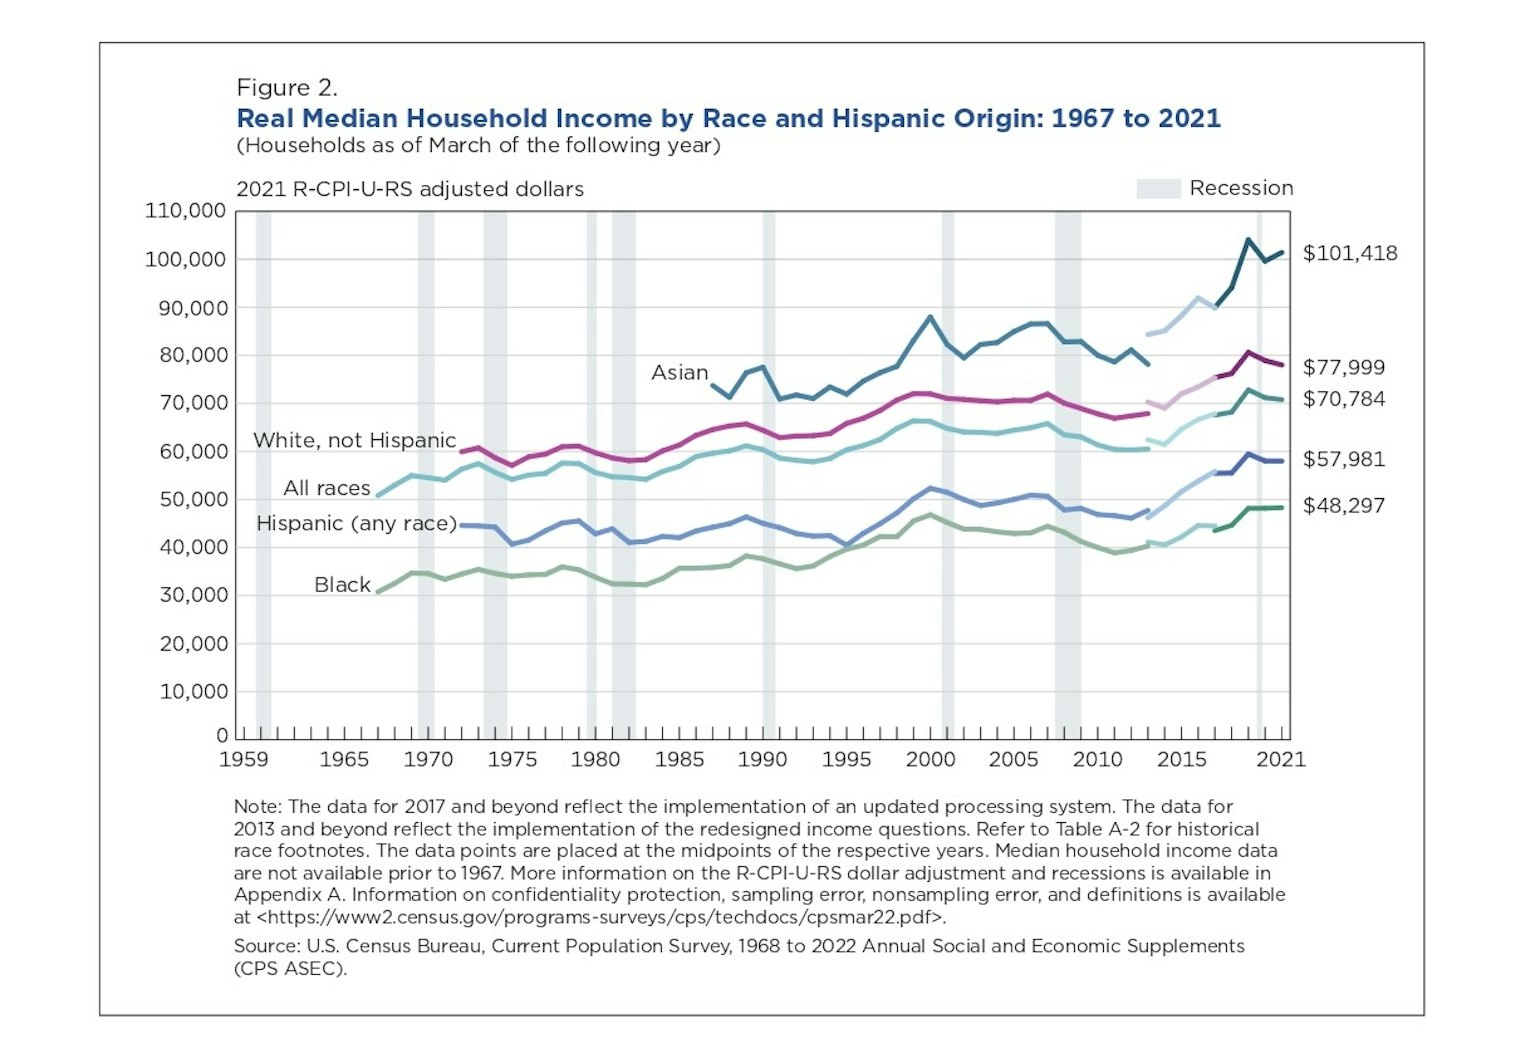
Figure 3. Illustrates growth in median household income from 1959 until 2021. Household income of Black Americans has persistently remained lower than any other race surveyed. Source: U.S. Census Bureau.
What can companies do to address pay gaps?
At PayAnalytics, we believe that each employer has the ability and the remit to make incremental changes that lead to a fairer world. It is possible, and it is necessary, despite friction and challenges, troughs and crests you may encounter along the way.
There are a few steps you can start thinking about right away:
- Promote a working culture that is not only open to diversity, but is also inclusive. Examining the entire workplace culture and cultivating lasting changes can and does lead to positive outcomes, though it can take a long time to unlearn socially conditioned behaviors.
- Job design is critical. Assign a value to both job and employee characteristics based on standard and objective criteria. Use our job evaluation feature to build a compensation structure based on value—a key component of “equal pay for work of equal value.”
- Perform job classification to become aware of which employee qualities or qualifications you consider important for each job for equal pay analysis, a major early step on your pay equity journey. (You can read a little bit about how to classify jobs in our e-book).
- Make jobs more flexible so that carers who must split work and home responsibilities can better maintain work-life balance and keep their career on track.
- Share your results with internal and external stakeholders to encourage accountability and highlight accomplishments while setting meaningful goals.
- Speak to your company’s leadership and board of directors to get the support you need to carry your initiative forward. (Learn more in our article about speaking to your Board of Directors)
- Train managers and other staff who regularly interact with diverse colleagues in sensitivity, unbiased performance assessment, and pay determinations. (For more on this, watch our Coffee Talk on implicit bias).
- Measure, measure, measure. Repeat.
How do you measure your own demographic pay gaps?
And this brings us back to measuring your demographic pay gaps. Now that you have a theoretical foundation for thinking about and talking about them, it’s time to put pen to paper (or get ready to demo PayAnalytics!).
Have a look back at part 1 of this blog series to learn about median and average calculations for the pay gap. In part 3, we’ll look at those calculations in more detail and dip our toes into regression analysis and its benefits. Stay tuned.
Book your 1:1 demo with one of our pay equity specialists
We’re always happy to talk with you about your pay equity journey, whether you’re at the very beginning stages or farther along the path. Feel free to get in touch with us at any time. Let’s get going.